Riddell
Riddell– Microsoft Power BI

Client Profile
Riddell is a leading manufacturer of football helmets, protective sports equipment, and innovative sports technology solutions aimed at improving player safety and performance.
Client Industry
Sports Equipment & Technology
Business Challenges
Riddell’s InSite Smart Helmets are equipped with impact sensors that collect real-time data on player head impacts. This technology provides valuable insights into player exposure levels, helping coaches and trainers make informed decisions to improve player safety and technique. However, despite having access to this data, their users faced several challenges:
- Limited Data Insights
- While helmets captured critical impact data, the existing system lacked an advanced analytics platform to help users fully interpret and act on player safety and performance metrics.
- Lack of Integration
- The platform didn’t seamlessly connect with other essential tools like Power BI, Catapult, and Hudl, limiting comprehensive data analysis.
- Time-Consuming Manual Processing
- Coaches and staff had to manually process raw data, making it difficult to generate quick and actionable insights.
- Difficult Data Navigation
- Without advanced filtering and drill-down capabilities, identifying key trends and safety concerns quickly was nearly impossible.
- Scalability Limitations
- The system was not designed to integrate with future third-party data sources, making it challenging to expand its capabilities as new technologies emerged.
Solution
Plego developed the InSite Analytics Portal, delivering seamless integration, powerful insights, and high efficiency through a smart, user-focused platform to tackle the unique challenges faced by coaches, players, and support teams.
Plego achieved this by:
- Seamlessly integrating Power BI reports into a mobile-friendly web application, centralizing all impact data for quick access.
- Enhancing data clarity with dynamic visualizations, making player safety and performance metrics easier to interpret.
- Designing an intuitive user experience using ReactJS and Material UI, reducing manual processing and simplifying navigation.
- Minimizing administrative workload by streamlining data retrieval, allowing coaches to focus more on strategy and player development.
- Implementing advanced filtering and drill-down capabilities to help users quickly pinpoint critical insights.
- Enabling customizable user profiles with saved views, role-based access, and personalized alerts for tailored data experiences.
- Building a scalable backend using Python/Django, ensuring seamless integration with future third-party tools like Catapult and Hudl.
- Optimizing performance and security, providing fast, role-specific access to impact data exactly when needed.
- Future-proofing the platform with a flexible architecture, allowing effortless expansion as new technologies emerge.
Dashboard
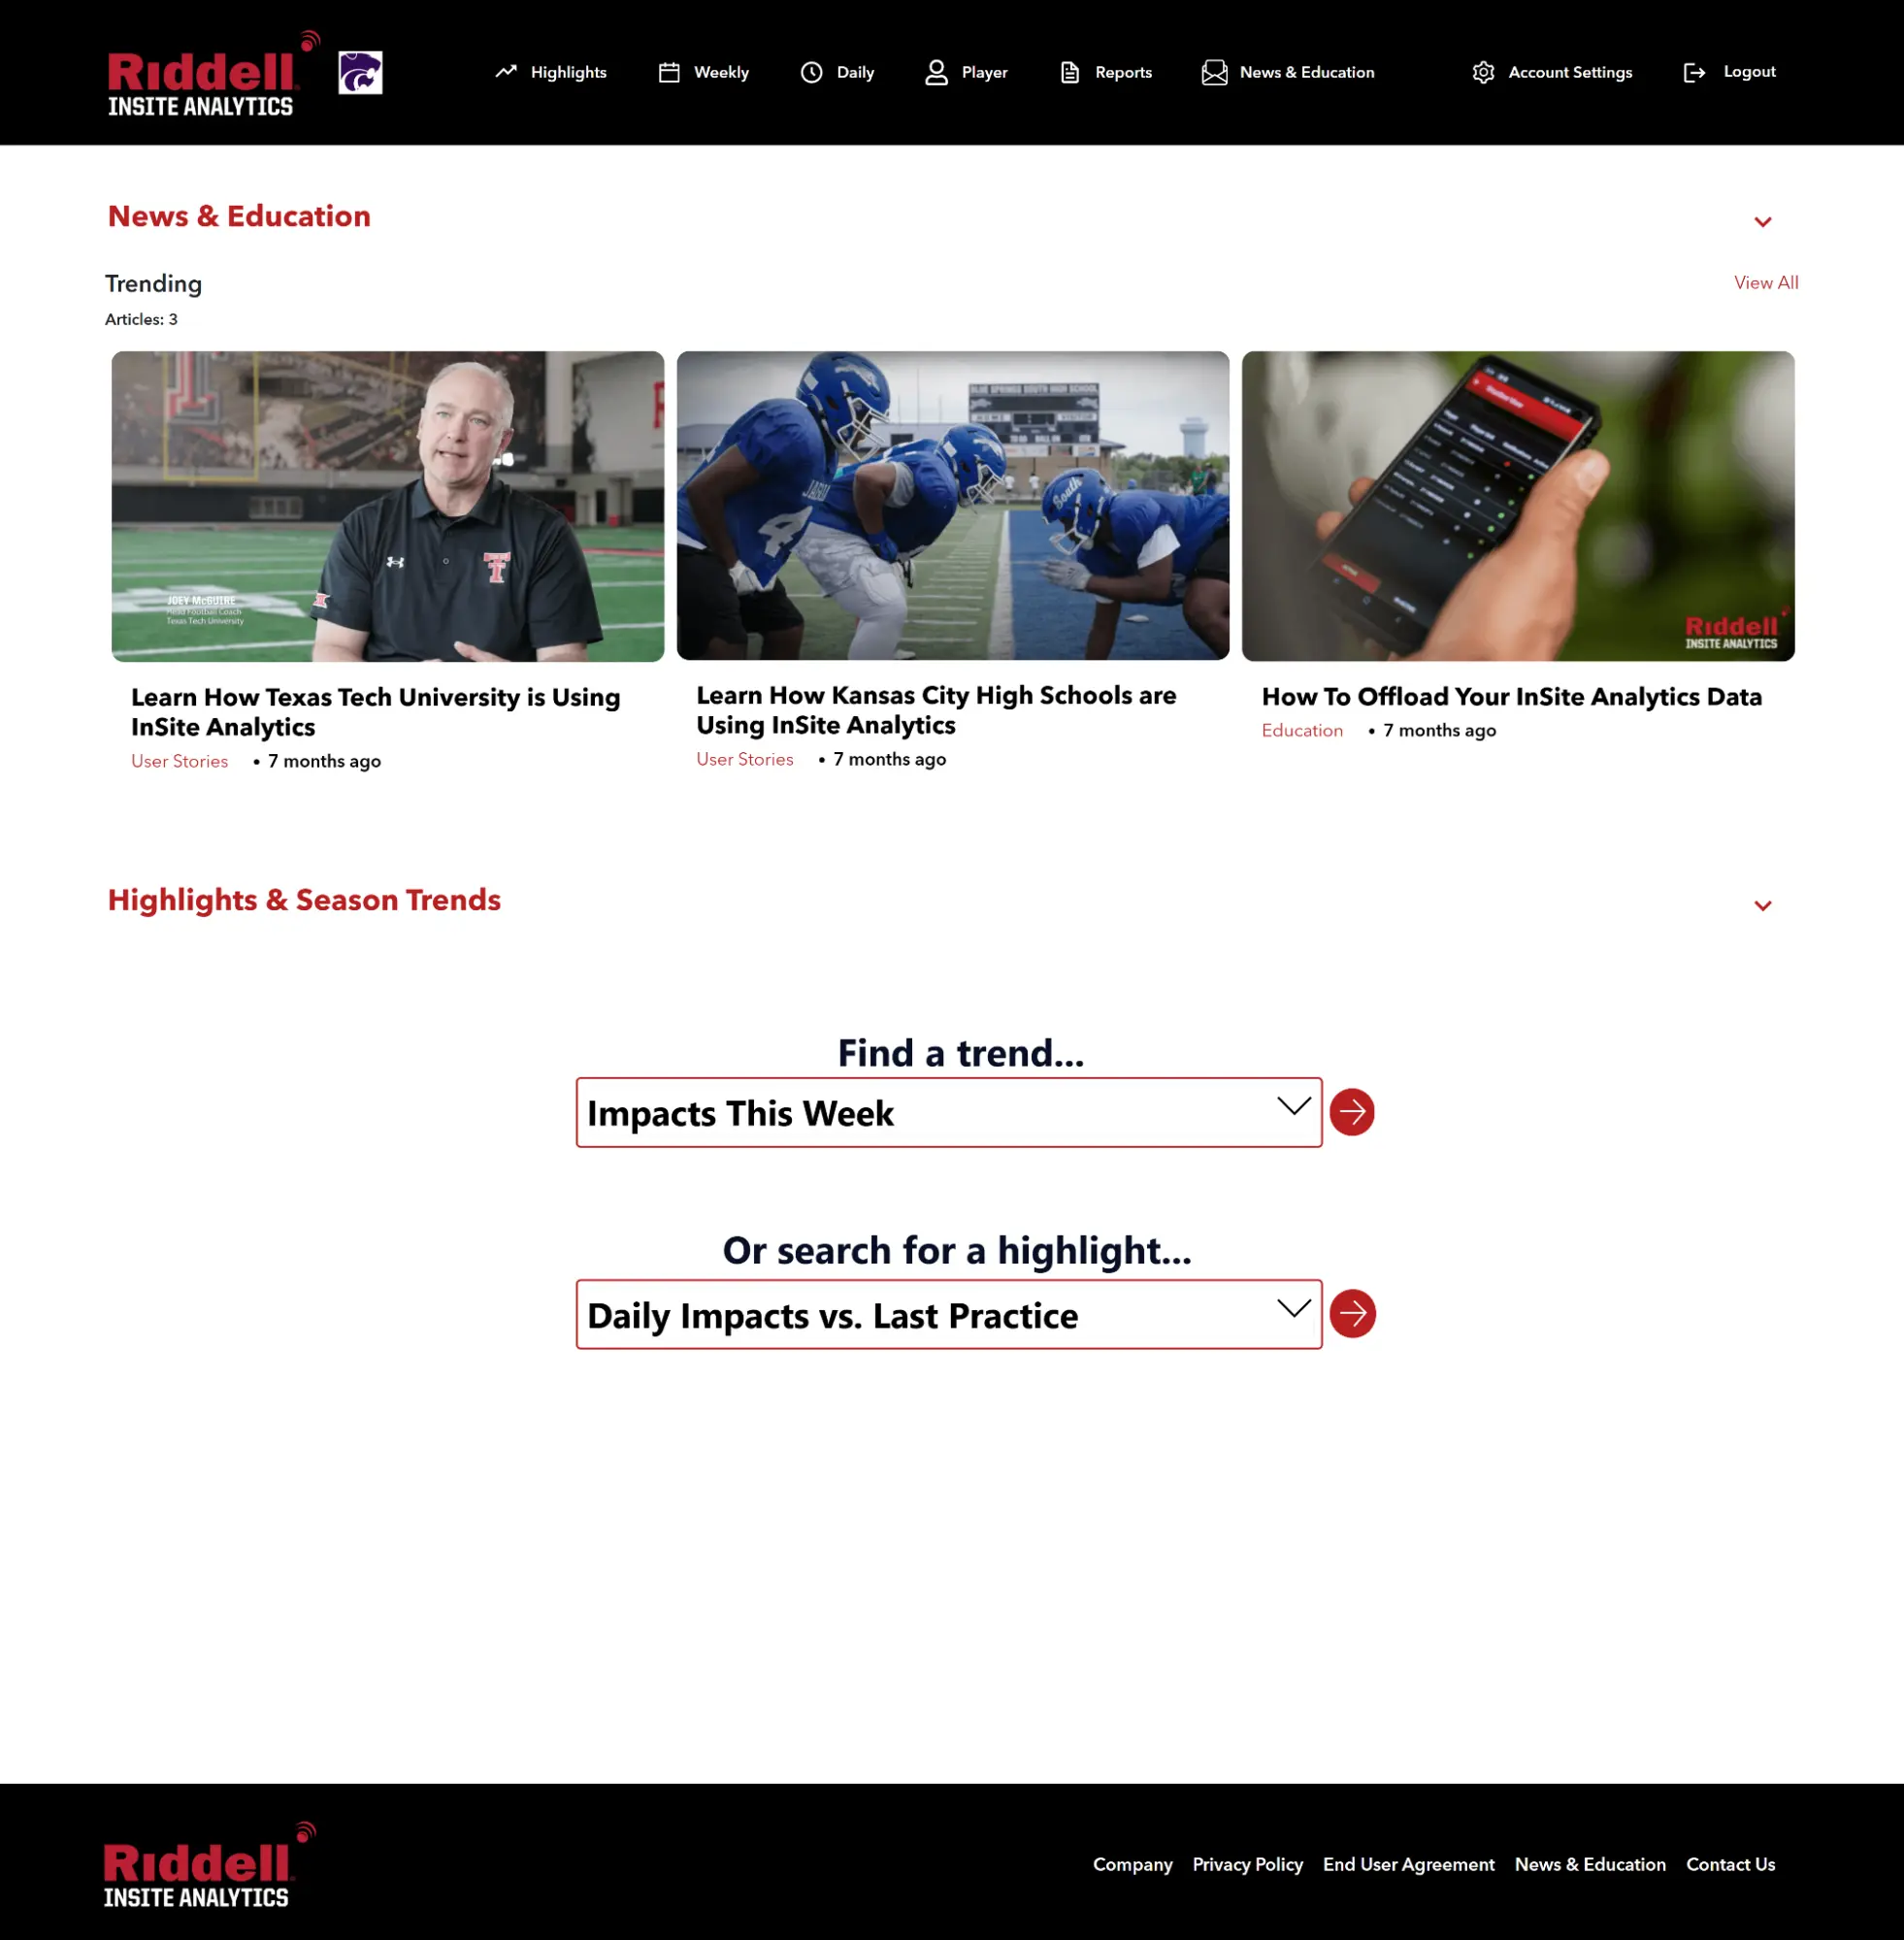
The InSite Analytics Dashboard serves as the central hub for coaches, athletic trainers, and staff, providing a high-level overview of key impact trends and insights.
- News & Education Section
- Displays relevant articles, user stories, and educational content to help users maximize the platform’s benefits.
- Highlights & Season Trends
- Allows users to track trends such as weekly impact reports and compare daily impacts against past practices.
- Quick Data Access
- Dropdown selectors enable users to filter and search for specific trends or highlights, making it easy to analyze player safety and performance metrics.
- Seamless Navigation
- The top menu provides instant access to weekly and daily reports, individual player data, and Power BI reports for in-depth analytics.
This dashboard was built with a mobile-friendly, intuitive design using ReactJS and Material UI, ensuring smooth navigation and quick data retrieval.
Weekly Report
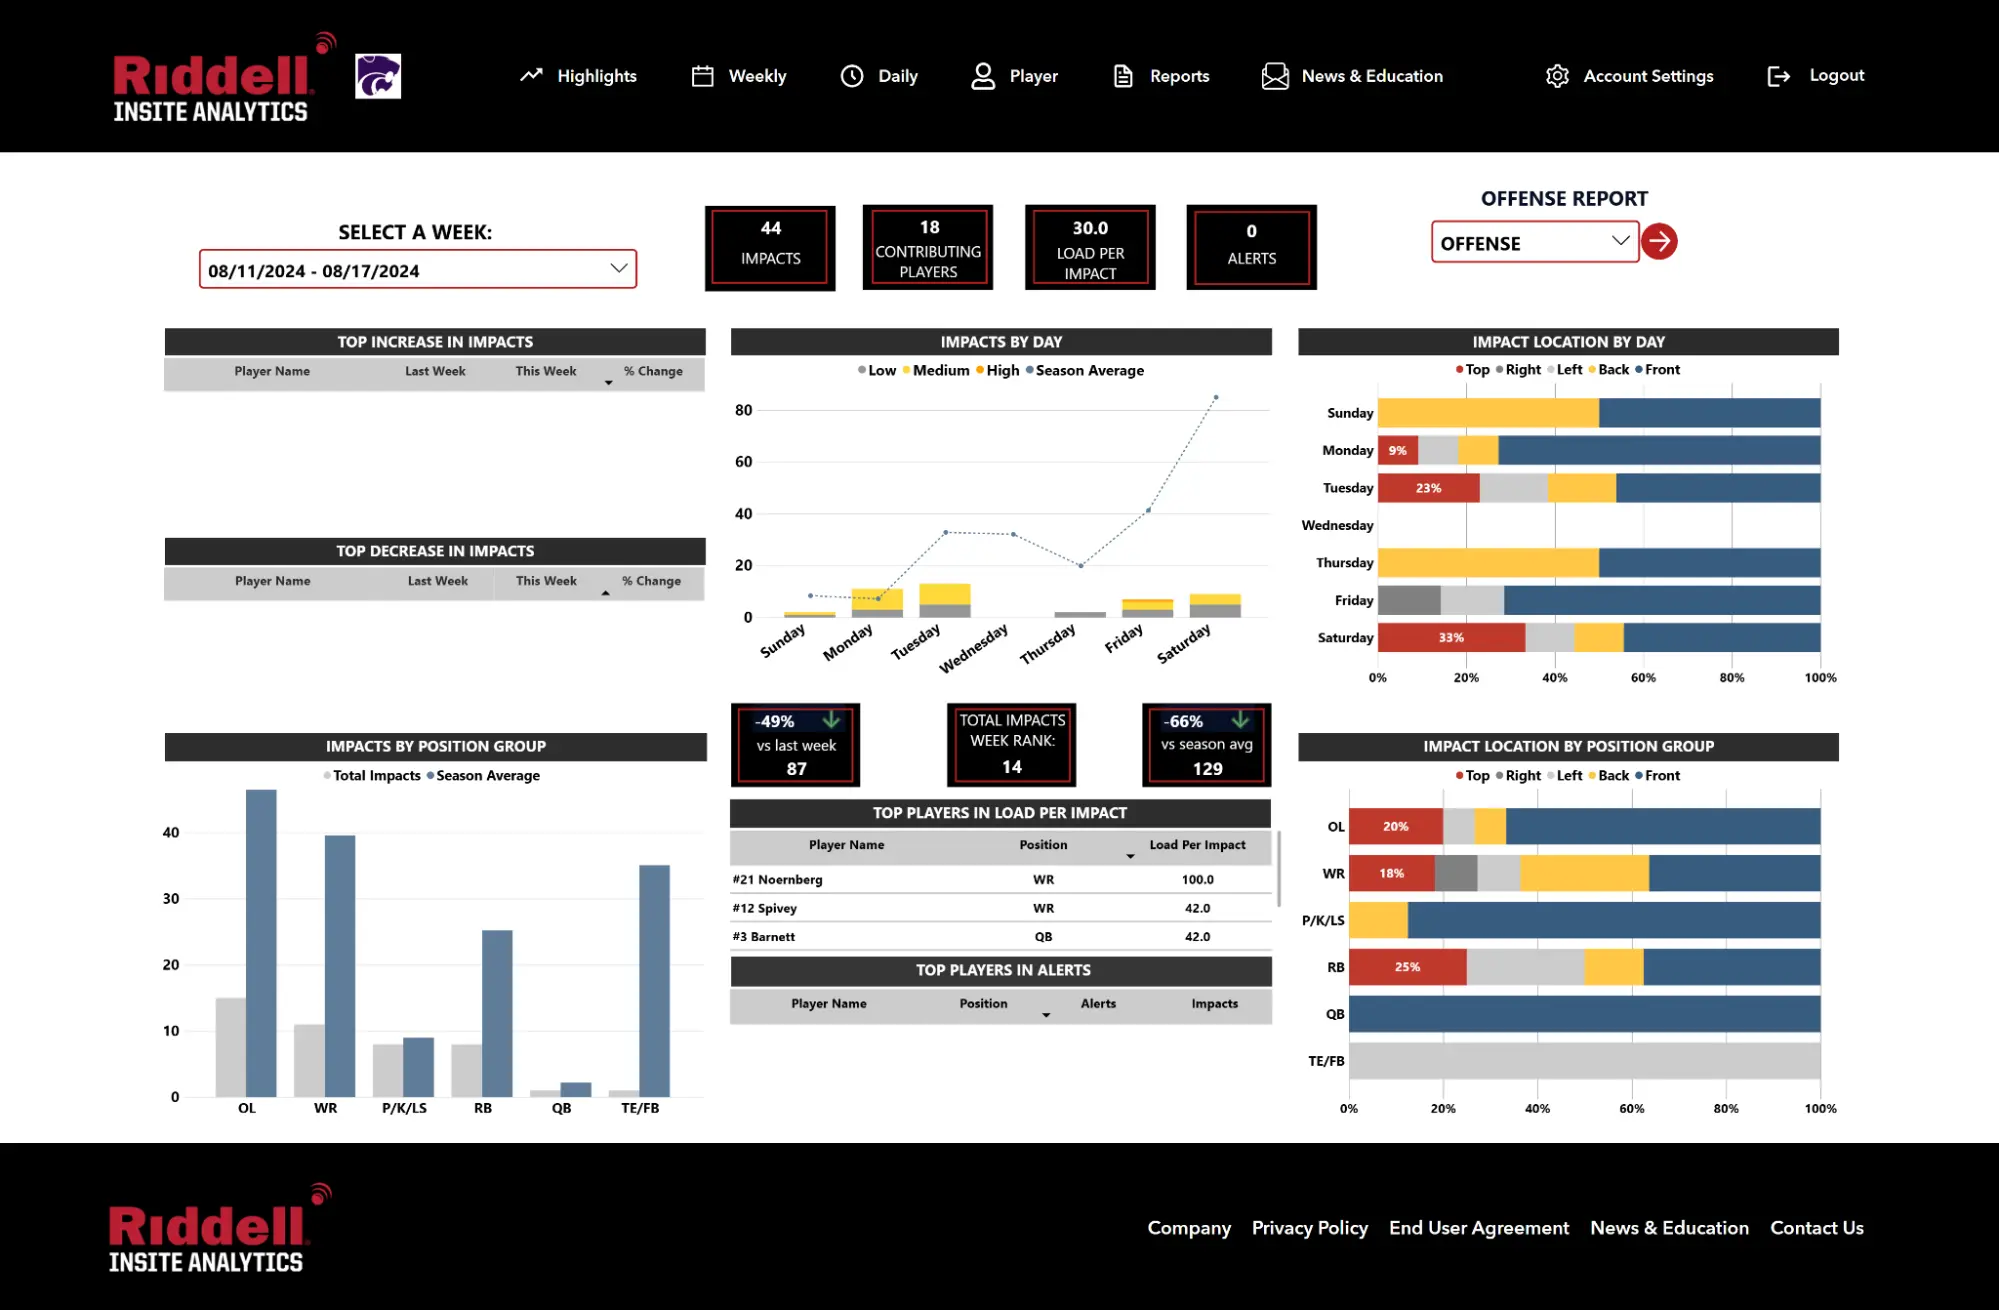
The Weekly Report provides coaches and staff with a comprehensive view of player impact data, seamlessly integrated with Power BI reports for detailed analytics.
- Impact Overview
- Displays total impacts, contributing players, and load per impact for the selected week.
- Impact Trends
- Graphs show daily impact fluctuations, helping teams identify peak days of activity.
- Impact Location Analysis
- Visual breakdown of where impacts occur by day and position group (top, right, left, back, front).
- Position-Based Insights
- Compares impact distribution across different positions (OL, WR, QB, etc.).
- Top Players in Load Per Impact
- Identifies players experiencing the most force per impact, allowing staff to monitor high-risk individuals.
- Performance Alerts
- Highlights players with critical impact alerts, aiding in injury prevention and training adjustments.
Built with ReactJS and Power BI Embedded API, this feature ensures real-time data visualization, enabling quick decision-making for player safety and performance optimization.
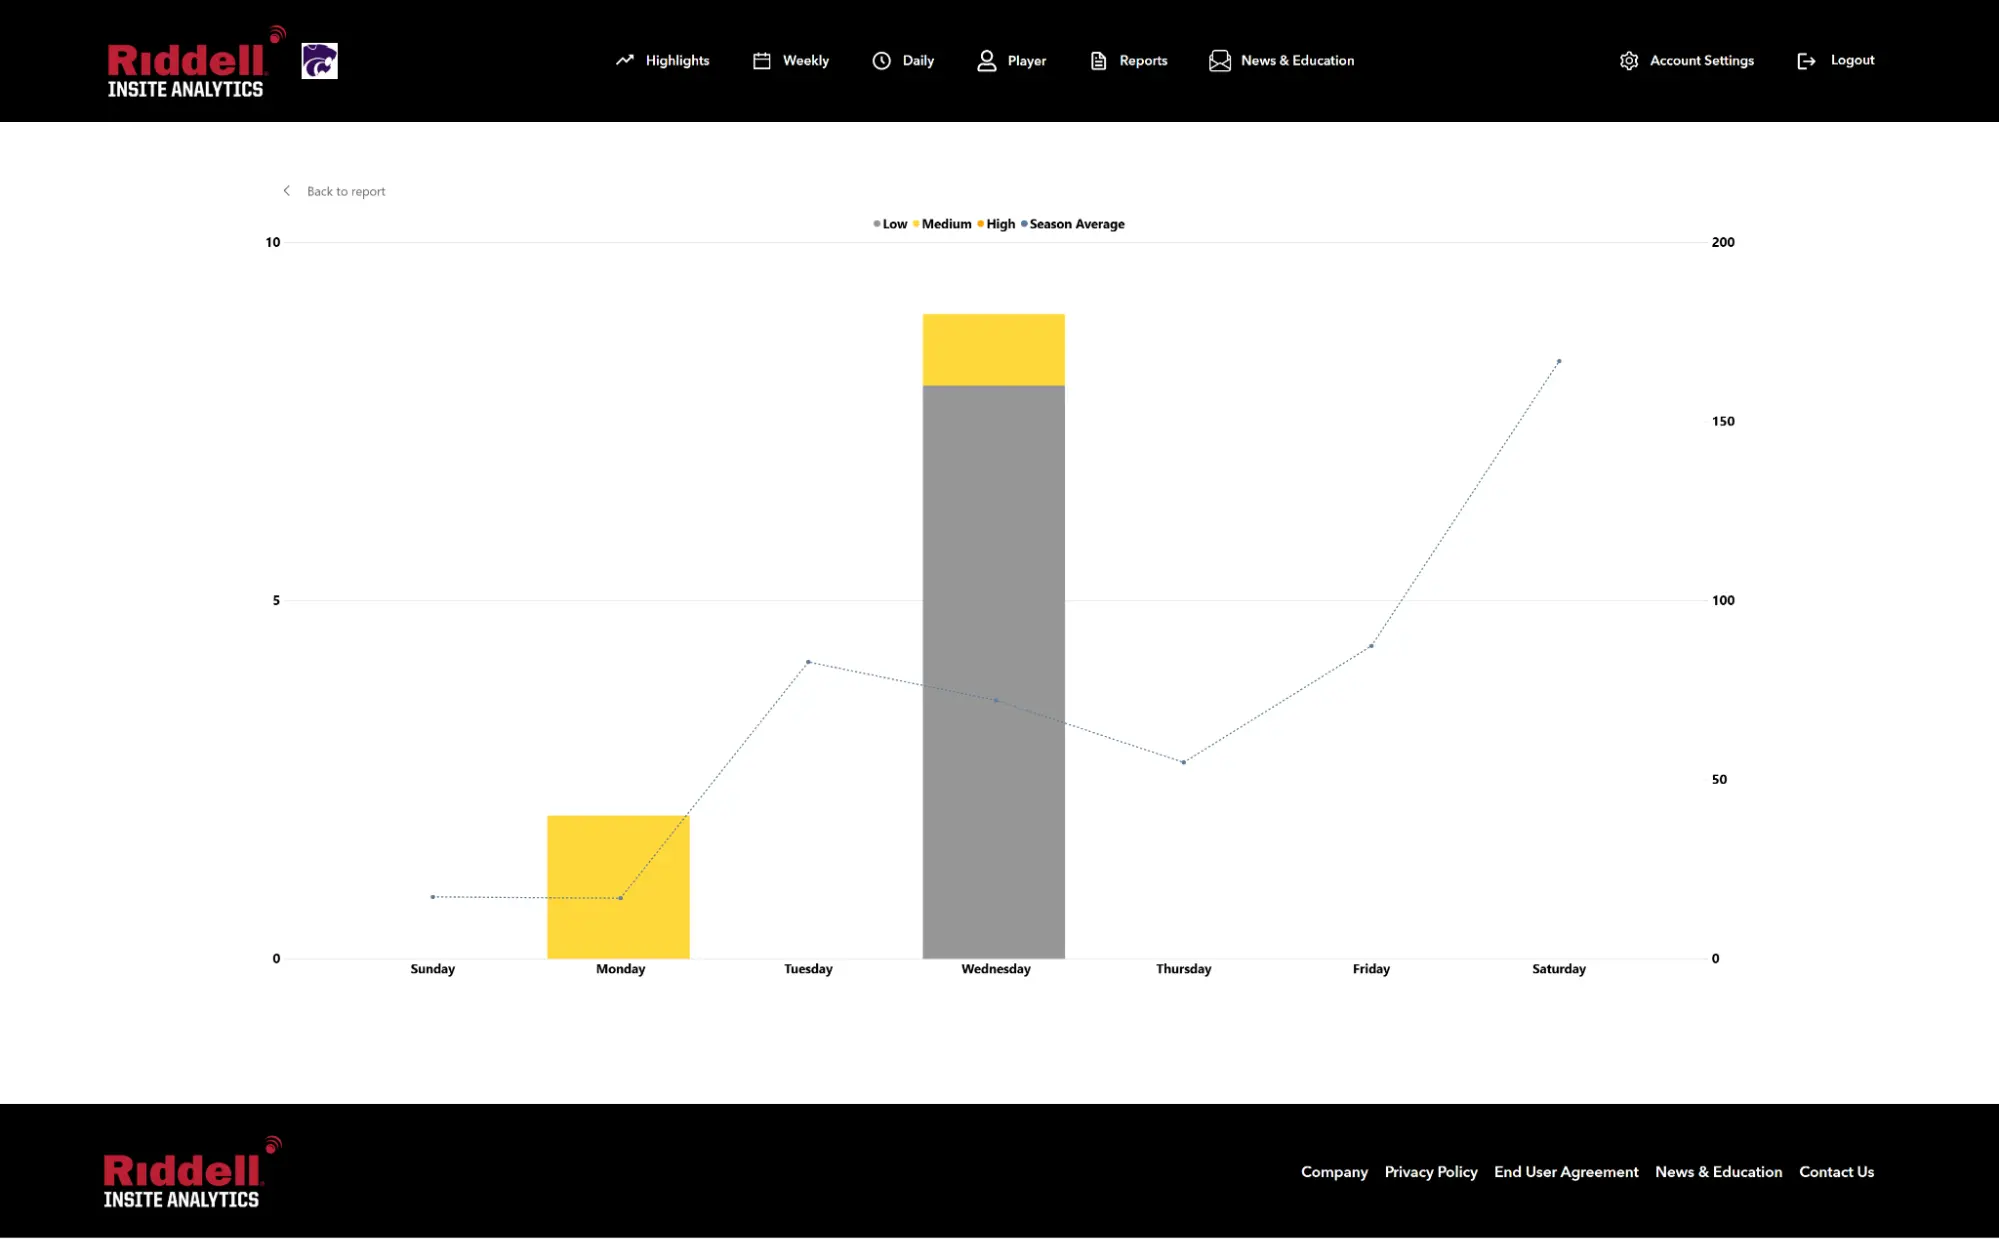
The Focus Mode in the Weekly Report provides a detailed, full-screen view of specific data points.
Player
Player Weekly
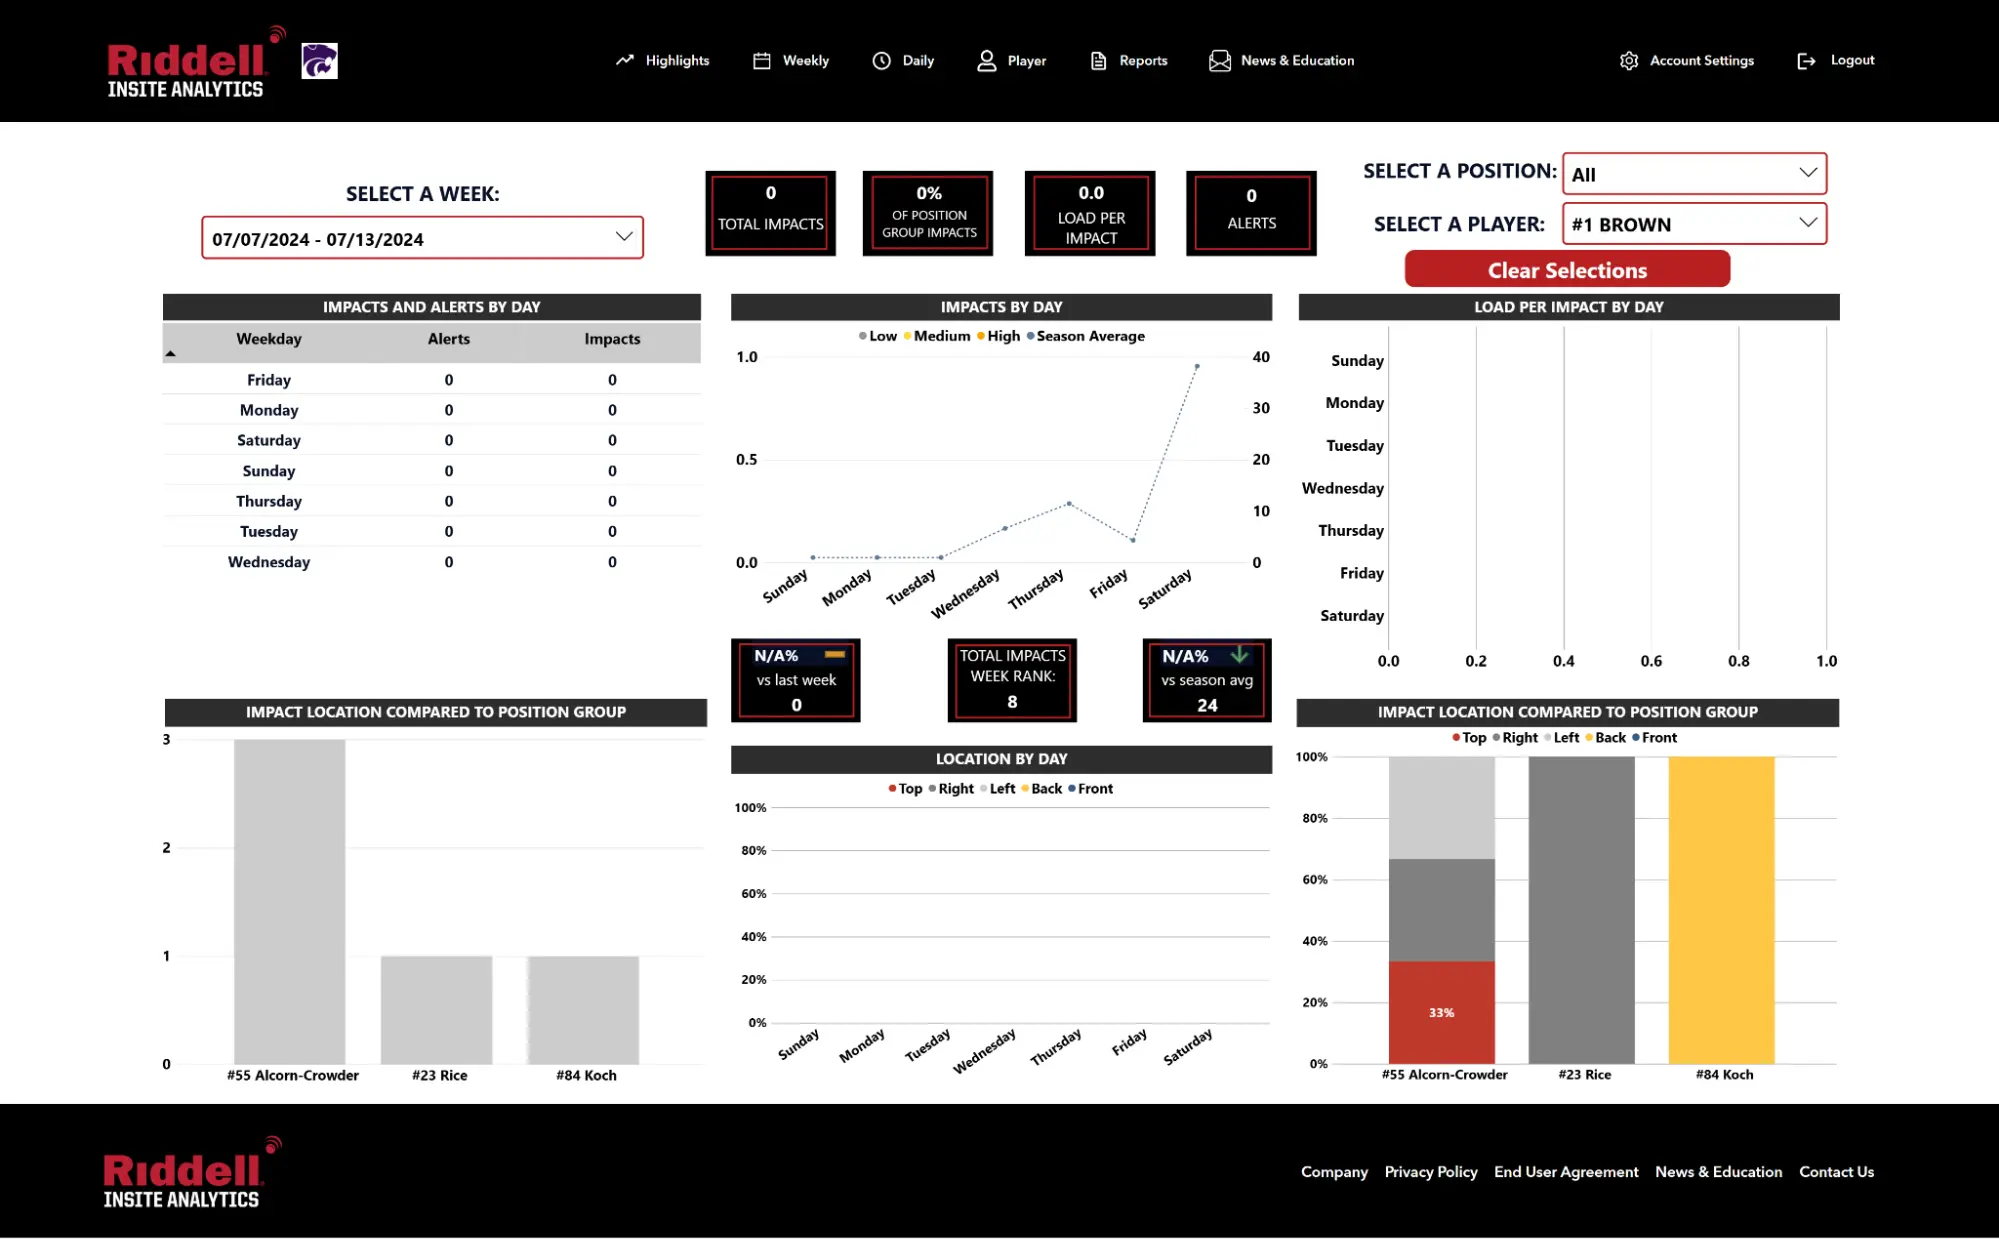
The Player Weekly Report offers detailed impact analysis for individual players, allowing coaches and staff to monitor performance and safety trends on a weekly basis.
- Week Selection
- Coaches can choose specific weeks to review impact data over time.
- Player & Position Filters
- Allows filtering by position or specific players for focused analysis.
- Impact & Alerts Breakdown
- Displays total impacts, load per impact, and alerts to track player safety.
- Impact Trends by Day
- A graph shows how impacts vary throughout the week, helping identify high-risk periods.
- Impact Location Analysis
- Highlights which areas of the body (top, right, left, back, front) are most affected.
- Comparison with Position Group
- Compares individual player impact patterns with other players in the same position.
This feature ensures data-driven coaching decisions, helping teams optimize player performance and reduce injury risks with insights directly integrated from Riddell’s helmet sensor technology and Power BI reports.
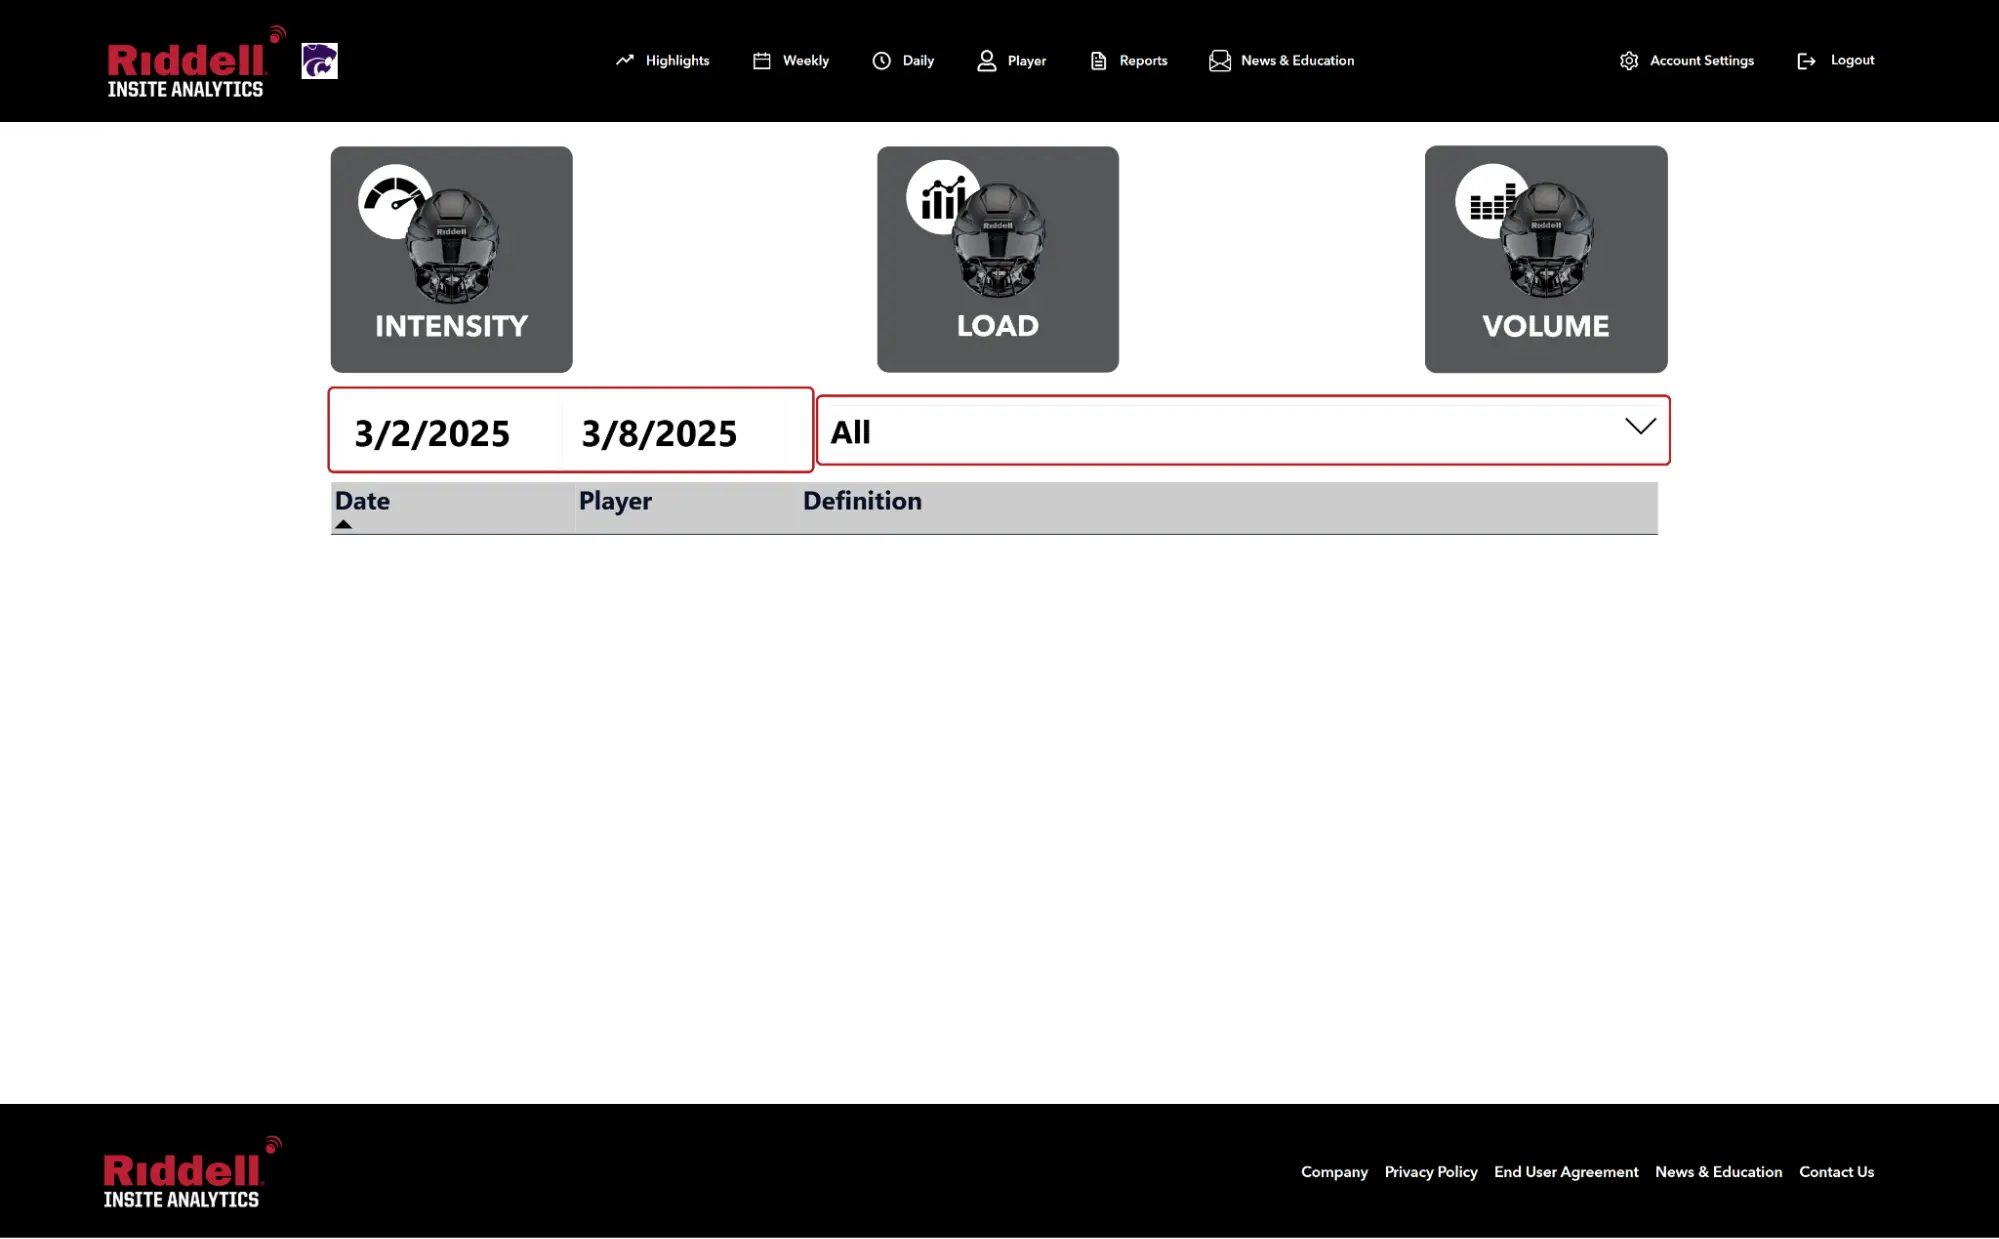
Player – Trends
The Player Trends feature provides a comprehensive breakdown of impact patterns over time, helping coaches assess player performance and safety.
- Impact Metrics Categories
- Data is organized into Intensity, Load, and Volume, offering deeper insights into player impacts.
- Date Range Selection
- Coaches can choose specific timeframes to analyze trends and compare past performances.
- Player Filtering
- Allows filtering by individual players or the entire team, enabling tailored analysis.
- Trend Visualization
- Highlights how impact intensity, frequency, and distribution evolve over time, helping teams adjust training and strategy.
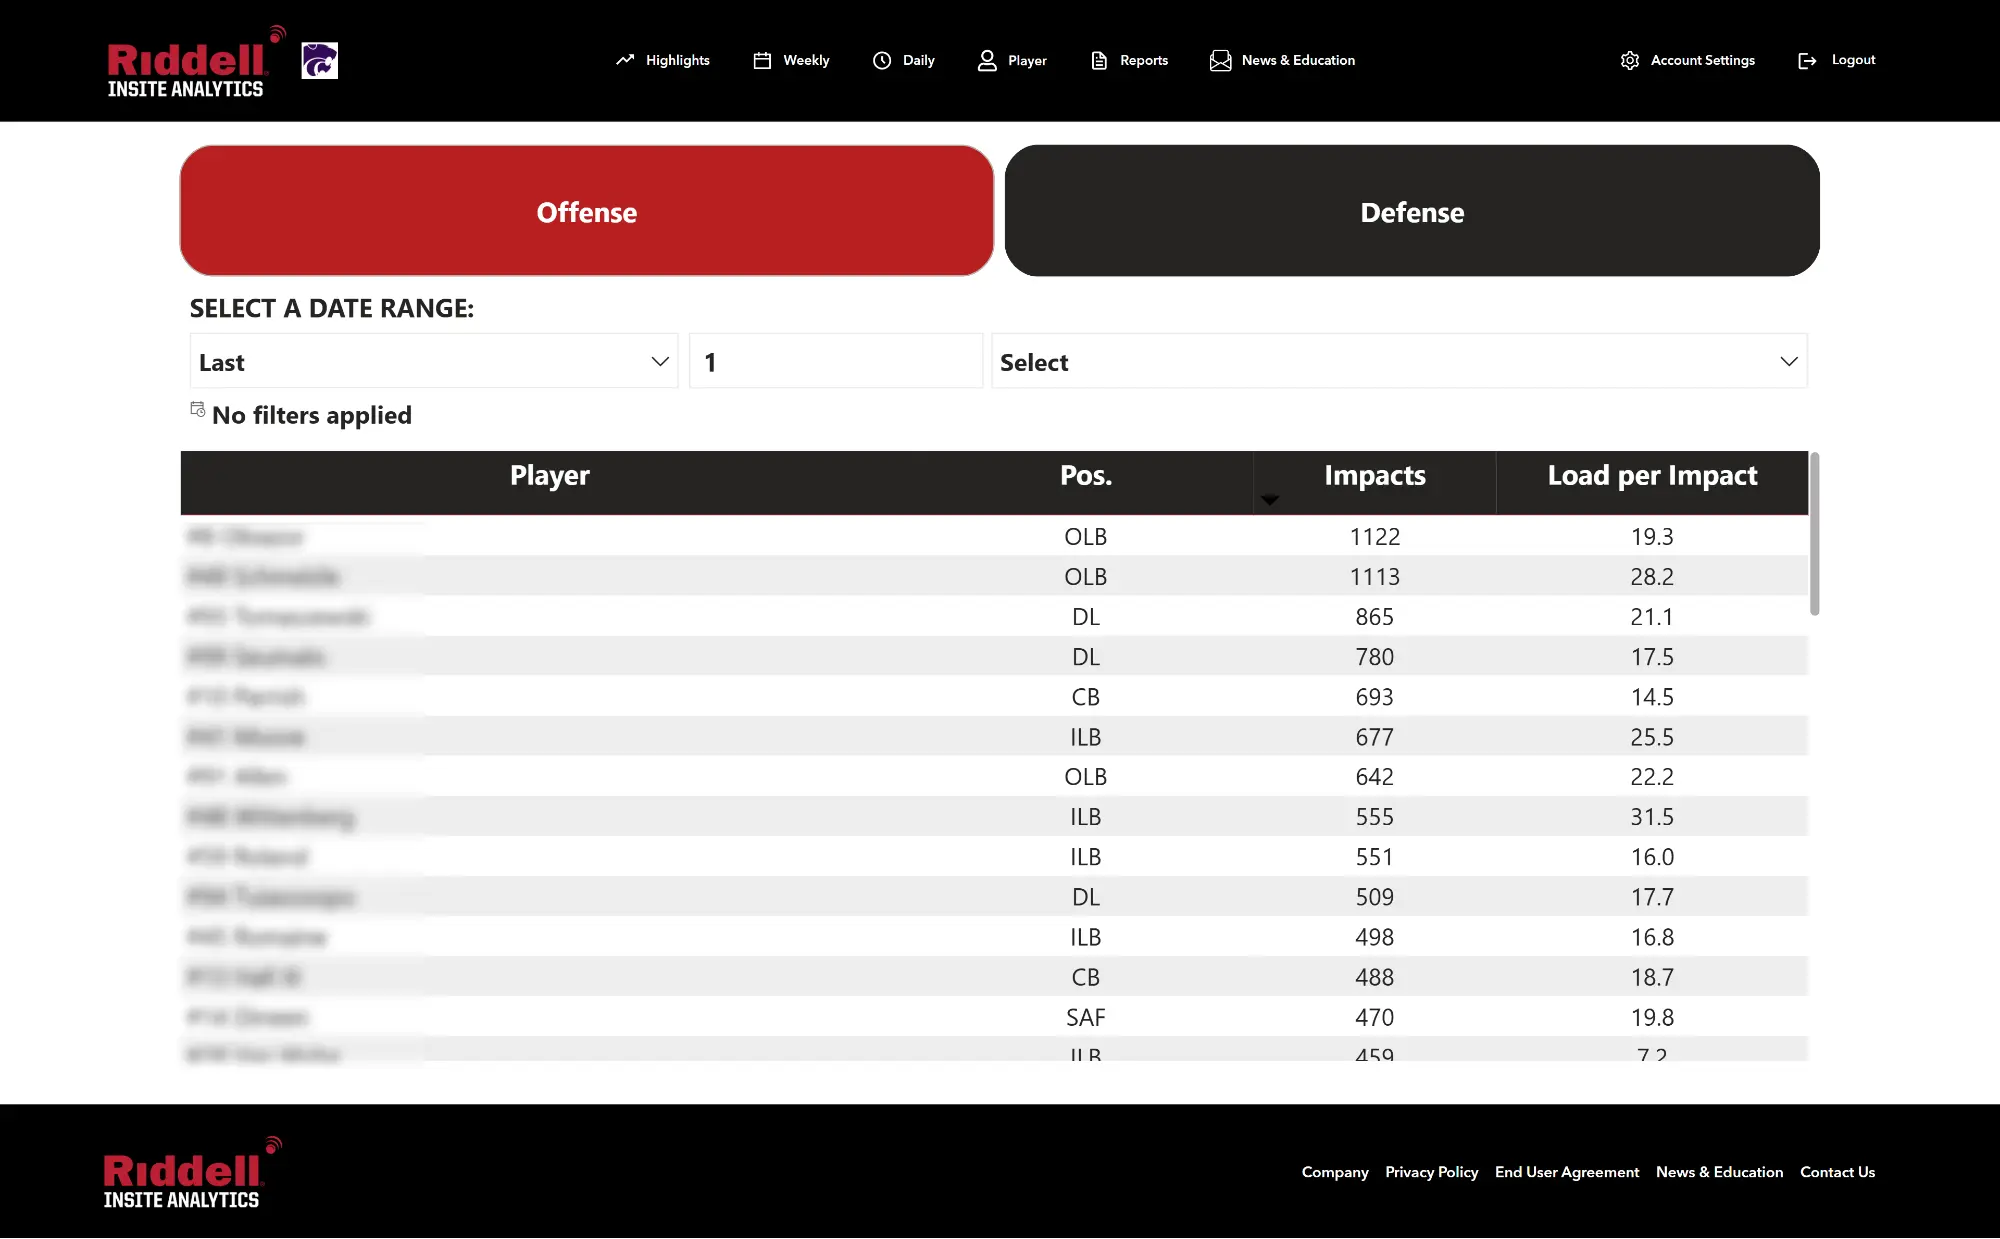
Player – Roaster View
The Roster View provides a comprehensive breakdown of player impacts across the team, enabling coaches to monitor performance and safety at a glance.
- Offense & Defense Toggle
- Easily switch between offensive and defensive players for targeted analysis.
- Date Range Selection
- Allows users to filter impact data by specific timeframes to track trends over days, weeks, or seasons.
- Sortable Player List
- Displays player names, positions, total impacts, and load per impact, making it easy to identify high-risk players.
- Custom Filtering
- Coaches can apply filters to focus on specific players, positions, or impact metrics for deeper insights.
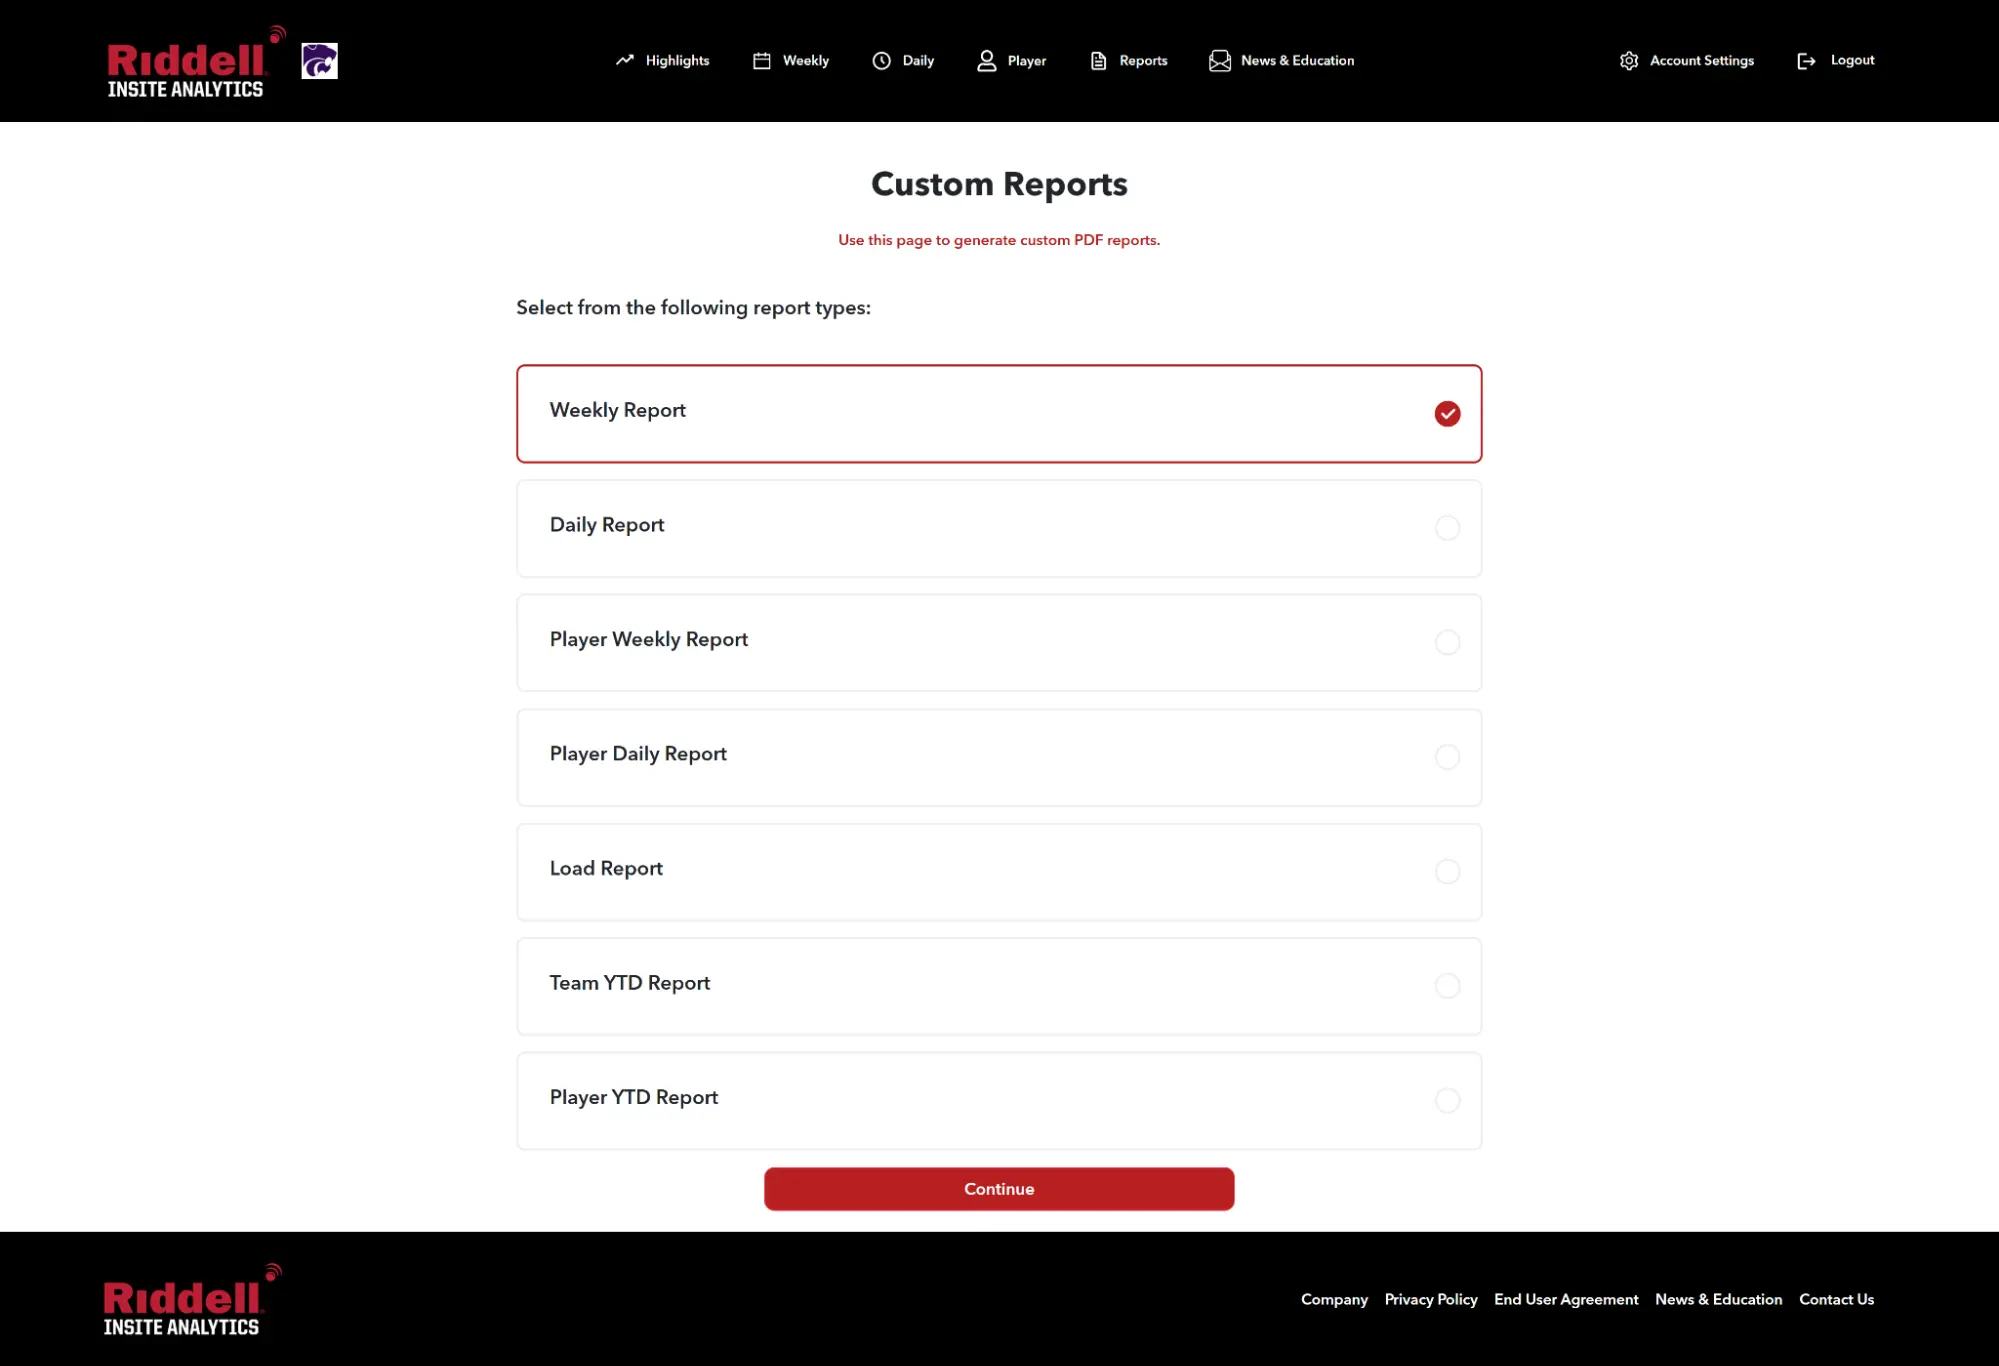
Reports
The Reports feature streamlines the process of generating customized PDF reports, helping teams track player safety and performance over time.
- Prerequisite for Report Selection
- Users must open or check a report first before they can access and select the report type in this section.
- Multiple Report Types
- Users can generate Weekly Reports, Daily Reports, Player-Specific Reports, Load Reports, and Year-to-Date (YTD) Reports based on their needs.
- Quick Report Generation
- With a single-click selection, users can instantly create downloadable reports.
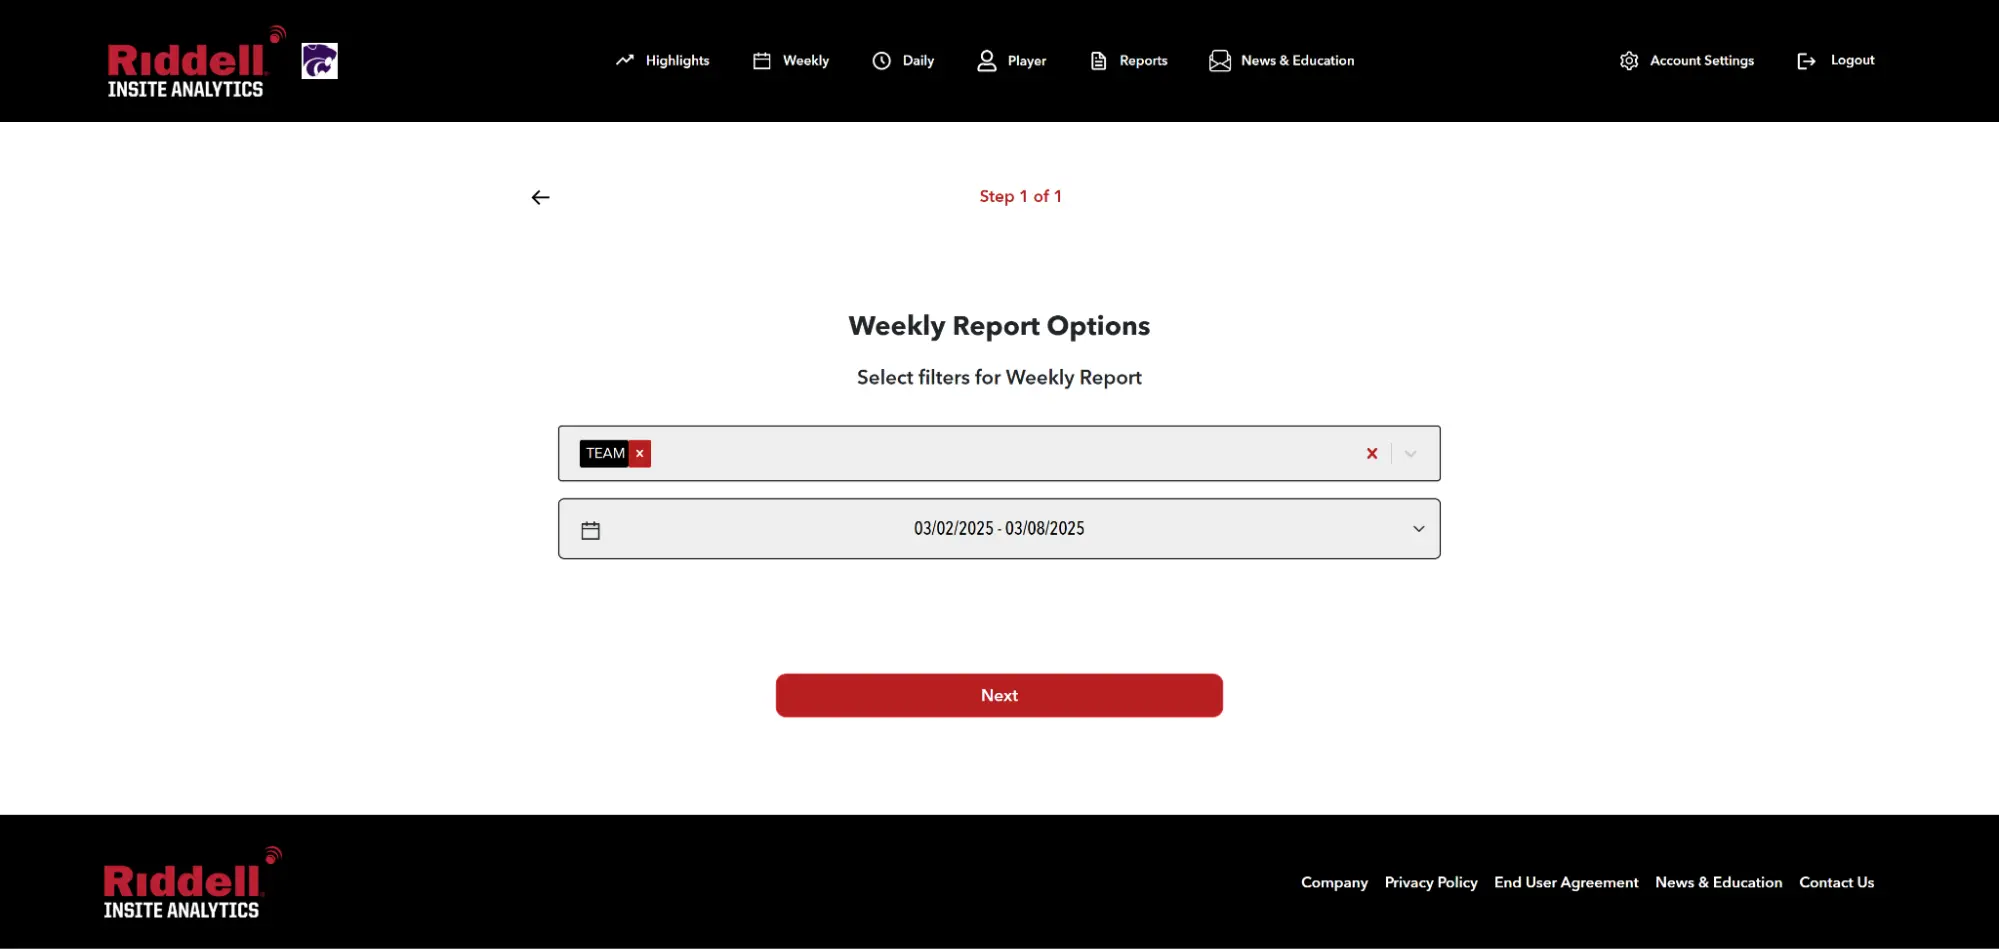
Reports – Step 1 of 1
In Step 1 of Report Generation, users can customize and filter reports before generating them.
- Users can filter by team, player, or date range to refine the report data.
- Clicking “Next” generates the selected report for review and download.
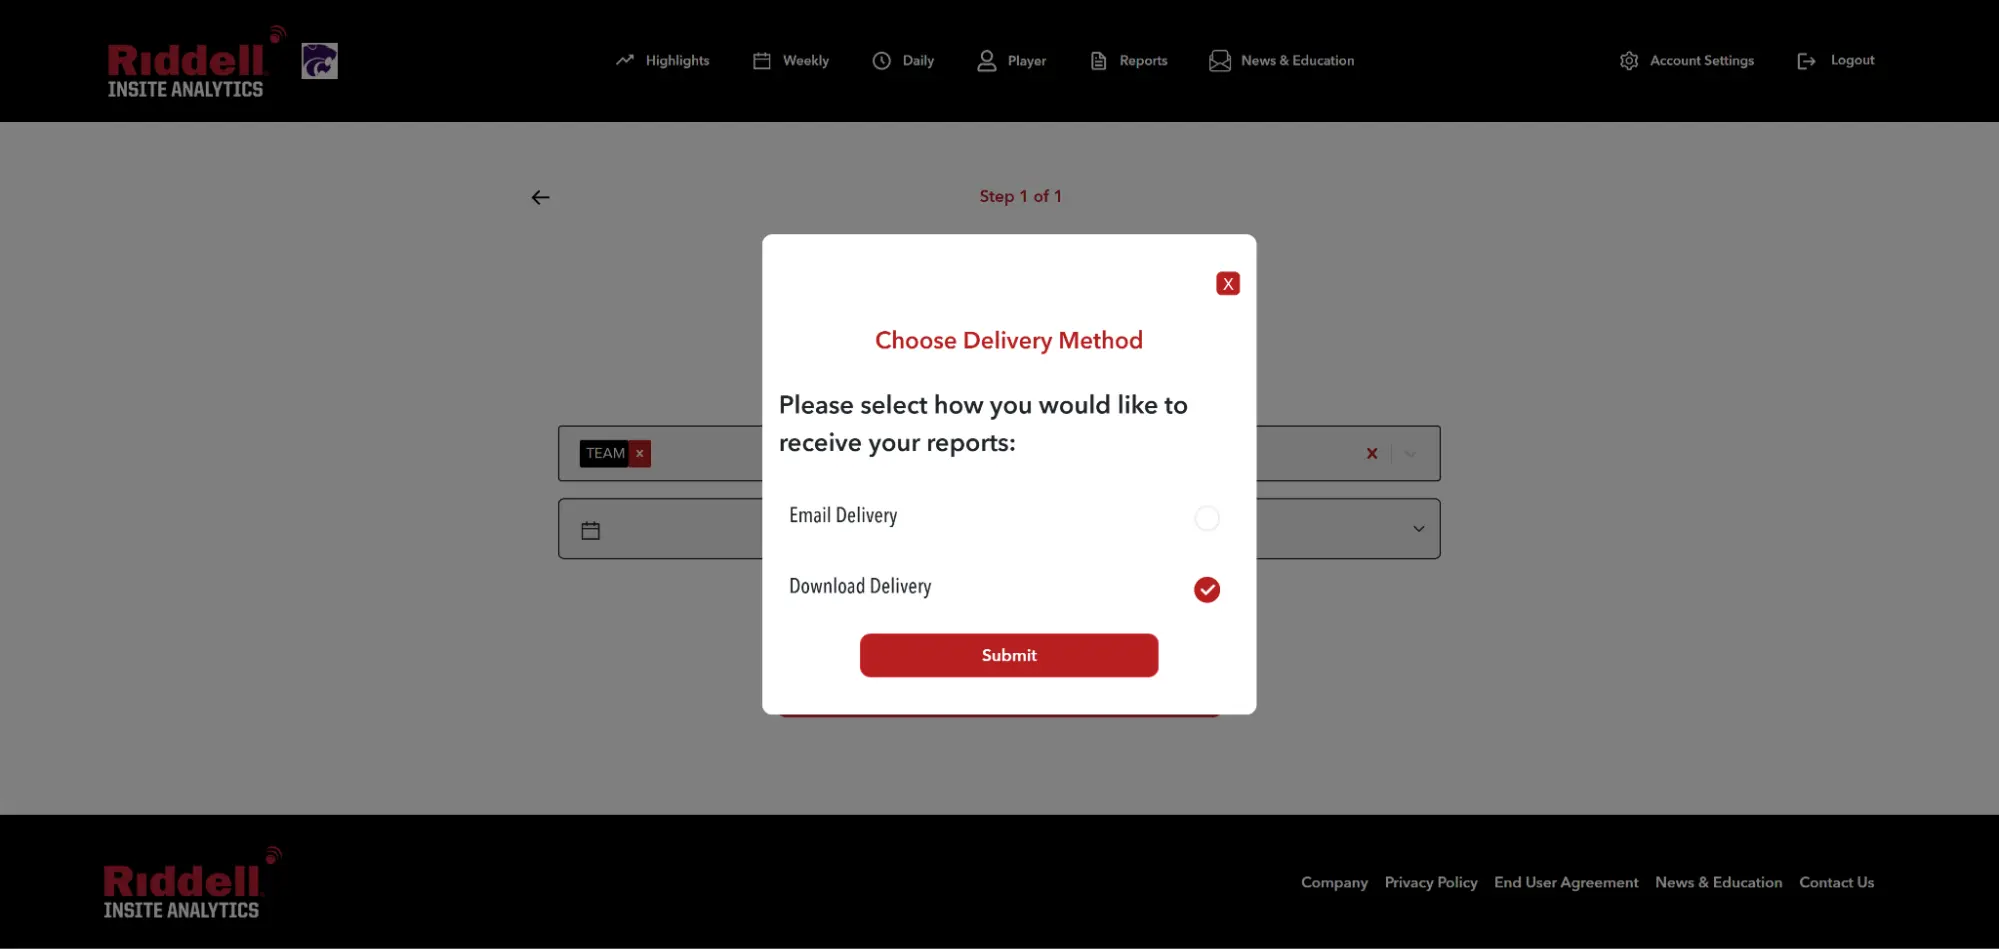
Reports – Delivery Method
The Report Delivery Method feature allows users to choose how they receive their reports after selection and filtering.
- Users can opt to receive reports directly in their inbox for easy access.
- Users can instantly download the report for immediate use.
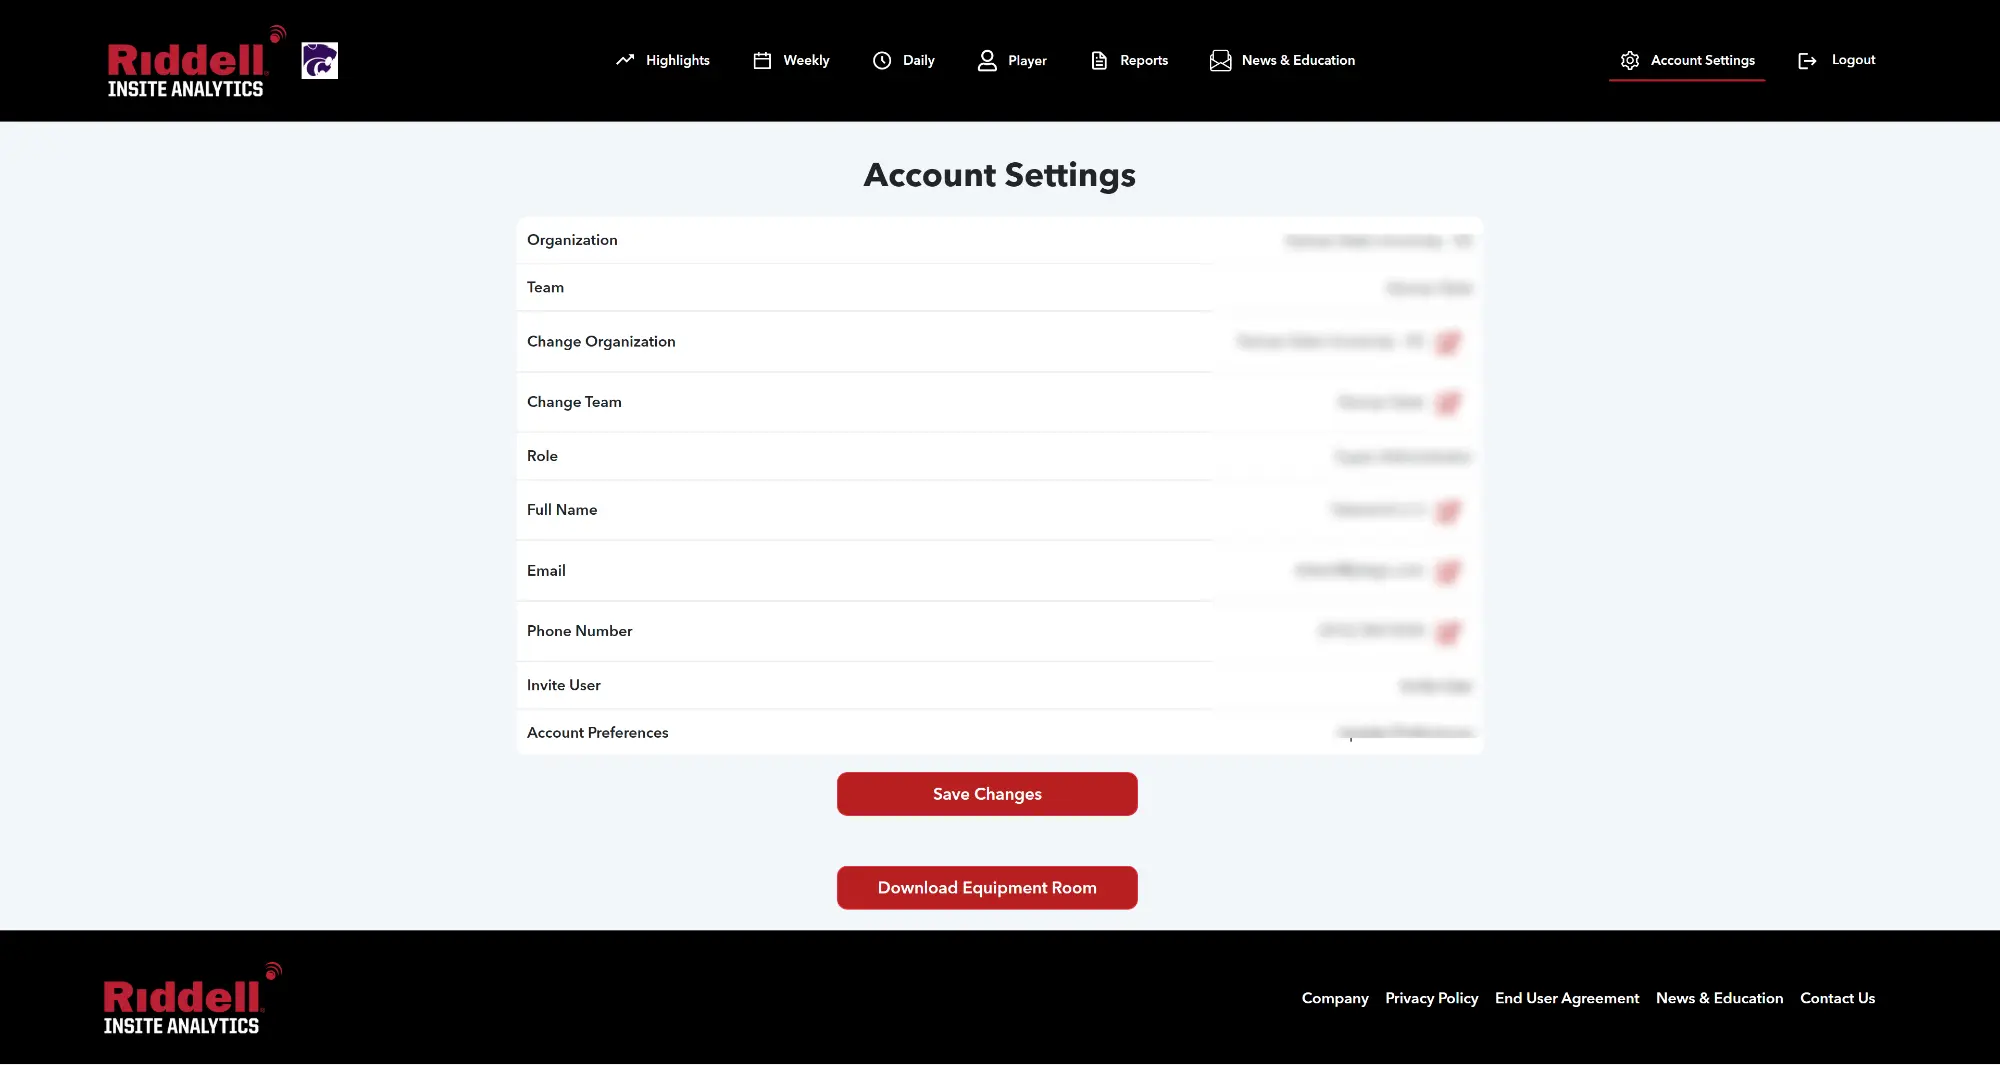
Account Settings
The Account Settings page lets users manage their profile, team, and organization details. They can update their role, contact info, and preferences, as well as invite new users when needed.
Admins can switch teams, adjust settings, and download equipment data for tracking. Everything is designed for quick, hassle-free updates, keeping coaches and staff focused on the game.
Technologies Used
Node JS (Nest JS), MongoDB, React JS (Next. JS), Microsoft PowerBI
Services Provided
Application Development, Integration